Slemma launches cloud data visualization tool aimed at smaller businesses
Whatever the size of a business, data is a crucial part of understanding and managing what's going on. But if that data is coming from several different programs it can be hard to pull it together to gain meaningful insights.
Slemma is a new browser-based data visualization tool that gives businesses an intuitive, collaborative and measurable view of their important metrics.
The platform allows users to pull from more than 300 sources including Oracle, IBM DB2 and Google Drive, and generate a custom dashboard with real-time updates that can be shared directly to an entire team or specific members.
"In today's business world, data is king, whether you run a small business or a large corporation," says Aleksey Yudin, Slemma's CEO and Founder. "Most businesses are running so many independent programs and platforms to track their data and numbers, but when viewed individually or on spreadsheets alone, none of it is truly measurable or actionable. Slemma is designed to provide decision makers with full visibility into their data in real-time, while making it simple for different departments to share and collaborate with one another".
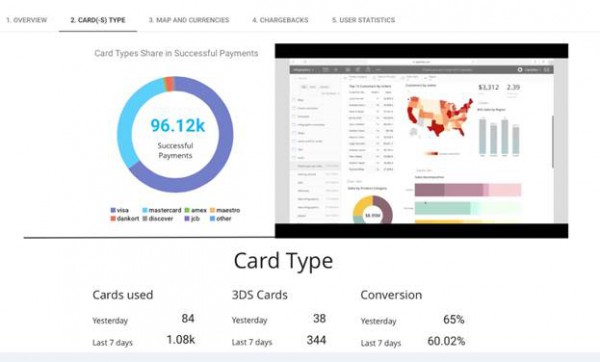
Thanks to fully customizable dashboards, Slemma users can select which data chart comparisons they want displayed and then share the project via a link, viewable on a web browser or tablet device. The data can be pulled from various sources including cloud storage and updates in real-time. Each project can be made public or remain viewable to only specific team members.
It's available as a free version that allows for basic spreadsheet uploads, a paid version tailored to smaller businesses with multiple data sources, and an enterprise service tailored to the needs of large businesses. To find out more and sign up for the free version you can visit the Slemma website.