Microsoft Power BI exits Preview -- will be generally available on July 24th
Data is the most important and valuable thing in the world. Diamonds and gold are just rocks in the ground by comparison. Want proof? Look at Google. Collecting information and storing data creates power and has huge value.
The problem with data, however, is that it only has value when it tells a story. In other words, you have to actually use the data you collect at some point. You can have giant SQL tables full of the secrets of the universe, but you need to be able to utilize and share it. Tableau is a popular visualization solution in the data analysis world, but it is clunky and confusing. Microsoft's solution, Power BI, looks much more promising and useful. Today, the company announces that it is exiting Preview and will be generally available on July 24th.
"Power BI make it easy for users to visualize and analyze their data in minutes, providing pre-built solutions for popular services as part of the Power BI experience. A subscriber to a supported service can quickly connect to their account from Power BI and see their data through live dashboards and interactive reports that have been pre-built for them. We have released content packs for 16 popular services such as Salesforce.com, Marketo, and Quickbooks Online. We have announced that over the coming months we will extend this support to include content packs and integrations for Adobe Analytics, comScore, Azure Mobile Engagement, Sage, SpaceCurve, tyGraph, CircuitID, Sumo Logic, SQL Sentry, Zuora, Planview, Insightly, Troux, Inkling, and others", says The Power BI Team.
The team further explains, "customers are no longer limited by the visualizations provided by their software vendor. Microsoft is opening its commercial grade visualization framework and visuals built on D3.js, enabling customers and partners to easily extend and build custom visuals. Along with the visualization framework we are also delivering a test suite and tooling. All of this is available today as an open source project on GitHub at https://github.com/Microsoft/PowerBI-visuals. In the future, customers will be able to bring these custom visuals into Power BI for use in their dashboards, reports and content packs".
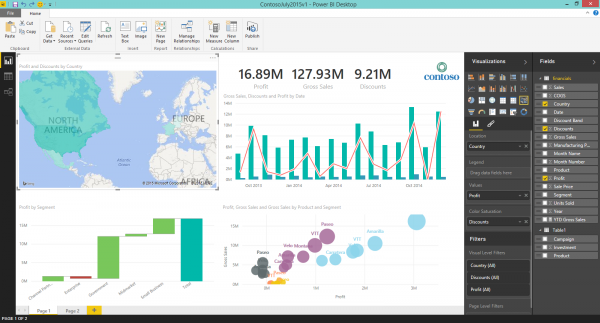
The Power BI Team shares the following Power BI Desktop (formally Power BI Designer) enhancements.
- New visualizations including matrix, area, waterfall, and donut charts.
- New visualization formatting such as color setting, titles, labels, and legends.
- New data source support has also been extended to include Zendesk, Intuit Quickbooks Online, AppFigures, GitHub, Twilio, and SweetIQ.
- Direct connection to SQL Server Analysis Services tabular models for data exploration. These and other new features will be available later this month.
Microsoft wisely understands that these visualizations need to be shared with multiple company levels, with the web being ideal. Remember, the higher you go up the corporate ladder, the less information you want to present. After all, a CEO for instance has very limited time and needs concise information to make decisions. Power BI will enable you to customize based on the audience.
The Android app in particular looks like a great way to share data and visualizations, but unfortunately, Android's presence in the enterprise is not particularly widespread. Hopefully Google's partnership with BlackBerry will make this change.
Data analysts and fellow data nerds, what do you think of Power BI? Are you excited that it is leaving Preview? Tell me in the comments.