4 reasons to move from Big Data to the Age of Insights

In the online world, where data aggregates, compounds and grows at a tremendous pace, your business probably has multiple tools for collecting data. But how many tools does it have for making sense of that data?
Are you able to merge or fuse sets of data together to fully understand your users? Do you have a single source of data in order to understand the complete user journey? Are you able to use the data to answer complex business questions? If you answered "yes" to the above questions, you’re a step ahead of many others. According to , online companies are continuously investing more in analytics. At the same time, however, their satisfaction continues to decline. How can online businesses become more confident about their analytics tools?
One answer is by incorporating the use of time-series analytics into your arsenal.
Time-series analytics, which measures a series of player actions over time, goes beyond traditional KPIs and metrics to deepen your understanding of user behavior. Let’s examine four ways time-series analytics does this.
You can find answers to important business questions that spur growth
Traditional metrics that focus on KPIs, such as pageviews, daily active users (DAUs) or average time on a page, still matter. But they only give you snapshots of the user journey. By analyzing raw event data over time, you’ll gain a more complete understanding of the user journey and be able to answer vital questions that spur business growth, such as:
- Why do some users remain loyal while others quickly churn?
- Why do some users have a higher LTV than others?
- What types of users are most likely to become VIPs or whales?
You can examine your users through multi-dimensional, rather than just one-dimensional metrics
Metrics such as pageviews give a one-dimensional view of user consumption. For a more valuable understanding of content consumption, a media publishing company measures pageviews, times on page, and share rates. But it also measures the completion rate and share rate of each article.
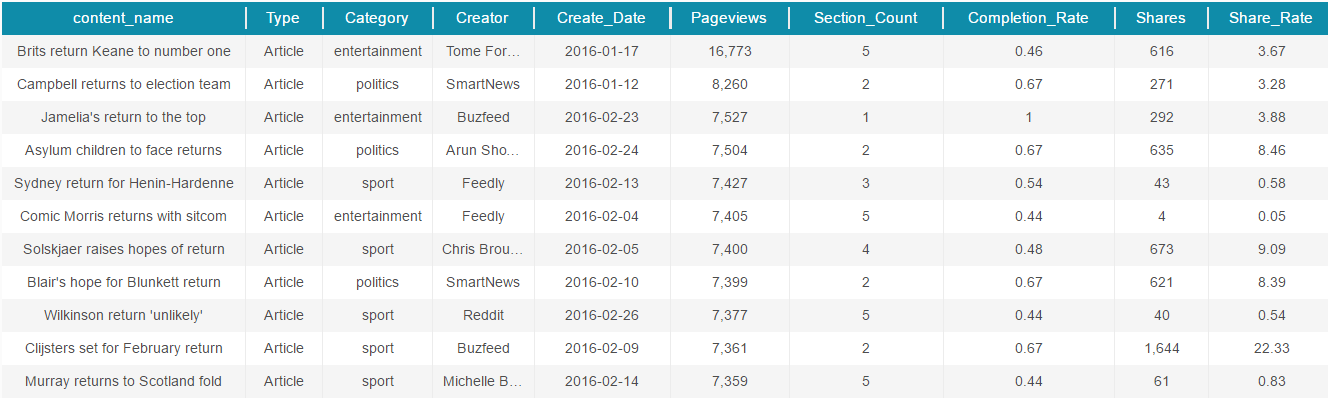
Although pageviews are highest in the entertainment category, the completion rate and share rates on average are highest in the sports and politics category. In addition, one article in the entertainment category from Buzzfeed was read completely. This media company might want to concentrate on producing similar articles in these categories from the same authors.
This type of multi-dimensional approach is far more valuable than one-dimensional metrics such as pageviews and provides a more complete picture of top content performance.
You can reveal patterns of user behavior which allow you to more accurately predict future behavior
How did your users react to the last marketing campaign, product offer, or UI change? , one method of analyzing user behavior over a period of time, gives you answers to this question, letting you optimize future marketing campaigns or product changes based on past behavior.
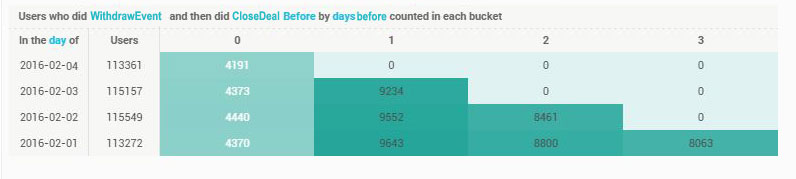
For example, a trading site is interested in understanding why there was a mass of withdrawals on a specific day. Were deals closed in the days prior to that? The reverse cohort analysis below shows that the number of withdrawals was much higher than the number of users who closed deals on preceding days. Based on this reverse cohort analysis, we understand that the trading site needs to continue examining other reasons for the withdrawals on that day.
You can unify your data from multiple sources to establish a single source of truth.
An advanced behavioral analytics platform allows you to unify data from multiple channels, devices and sessions. For instance, an ecommerce company can see that users are adding items to their cart anonymously. Users are only registered or identified before completing a purchase.
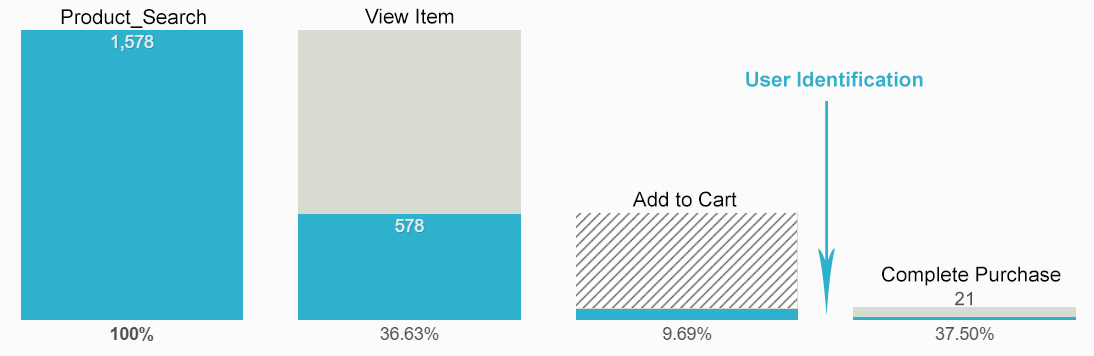
When we are only able to identify users at the point of registration, we miss out on a lot of online behavior from beforehand, and it’s harder to find the answers to questions about user behavior, such as:
- Why did users abandon their carts?
- What online campaigns generated the most conversions?
By unifying the identity of users from before and after registration and purchase, we can shed light on the answers to those questions.
When we analyze the Add to Cart and Purchase sections to compare segments of users by the different online campaigns of origin, we find that the Adwords Sports Campaign yielded the highest conversion.
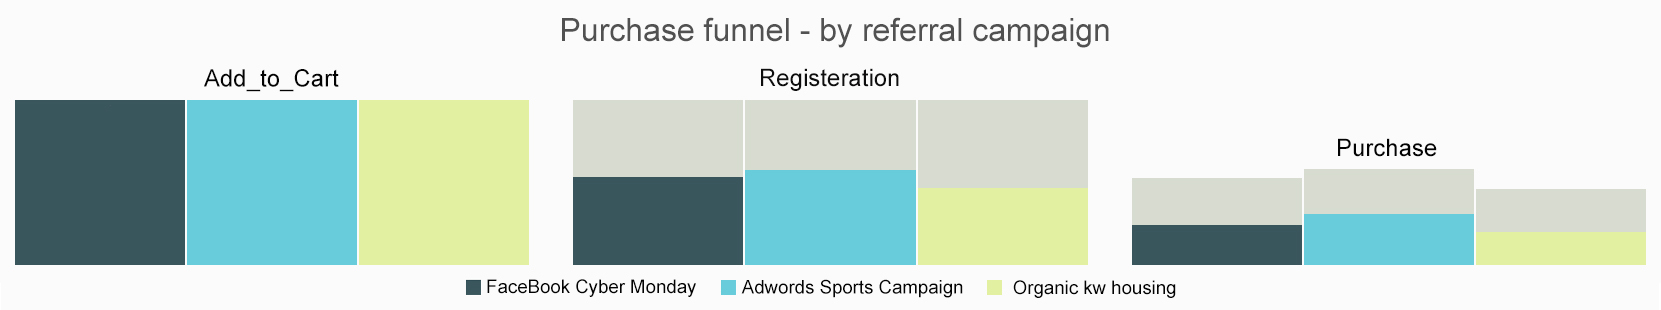
We can continue drilling down deeper with each campaign, audience segment, or part of the funnel to learn more about our users to help us optimize future campaigns.
Welcome to the Age of Insights
Big data is no longer a disruption in the online world. Companies are no longer measured by the amount of data they produce, but by the significance of the insights it possesses. By adding the right systems that not only collect that data, but make sense of that data, your business can have a competitive edge.
 Guy Greenberg is the Co-Founder & President at CoolaData, a leading behavioral analytics platform. Before founding Cooladata, he was the co-founder and CEO of Gilon Business Insight, which was acquired by Ness Technologies in 2010. At Ness Technologies, Guy served as Senior Vice President for Global BI and Big Data, where he worked with some of the largest corporations in the world. With over 20 years of experience in big data and startups, he is an active angel investor and adviser of several Big Data startups.