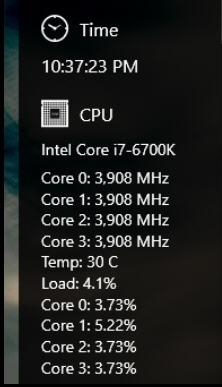
Sidebar Diagnostics is a stylish system monitor for your desktop
 Sidebar Diagnostics is a well-designed professional system monitor for Windows Vista and later.
No, we’re not usually interested in this kind of tool, either, but wait -- this is a package you might actually want to use.
It’s an open source project, so there’s no adware or other hassles, and you don’t even have to install it -- just unzip and go.
The sidebar appeared a few seconds later, and in a neat professional touch, a dialog prompts you to confirm it’s displayed correctly, and helps you fix any problems.
The default sidebar has all the key details you’d expect: CPU type, temperature and usage by core; RAM load, used and free; GPU details; network bandwidth usage per adapter; a very simple view of drive free space (a bar, no figures), and the date and time.
Normally we’d be concerned about the accuracy of these figures, but that’s not a significant issue here. Sidebar Diagnostics is using Open Hardware Monitor code to find all the necessary data.
This worked well for us, but if you’re unhappy with the defaults then there are plenty of tweaks available.
You’re able to customize the width, font, colors, opacity and more.
The sidebar can be displayed on the left or right side of the screen, moved to another monitor, set as "always on top", or set to reserve space for itself (maximize other applications and they’ll leave the sidebar visible).
There are various hardware options. You’re able to display more or less details for individual modules, turn some off altogether, reorder the others, maybe set temperature alerts for your CPU and GPU.
And although this is easy enough to control from the mouse, or a system tray icon, there are also optional hotkeys that can be customized to suit your needs.
Put it all together and Sidebar Diagnostics is an excellent system monitor, stylish, highly configurable and easy to use. Go grab your copy immediately.
Sidebar Diagnostics is an open-source project for Windows Vista and later.
