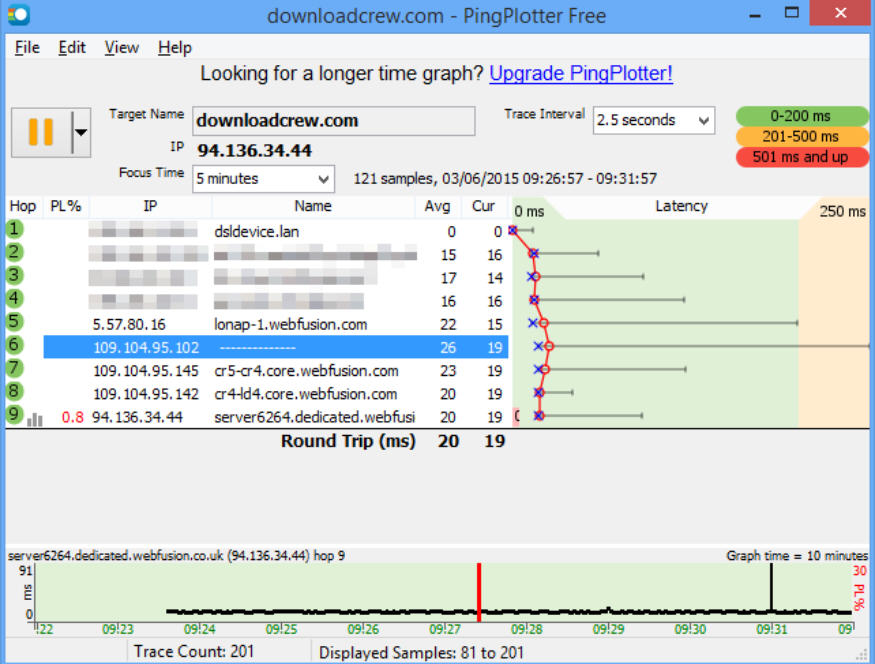
PingPlotter is a visual network monitor

The standard Windows Ping and Traceroute tools are capable enough, but their console interface is, well, basic, and GUI versions aren’t necessarily much better. All too often you’ll need to wade through tables to find the data you need.
PingPlotter Free makes life easier by taking a graphical view of network performance, giving all the essential core data at a glance.
The program requires installation, unfortunately -- no portable option here -- but after that’s complete it’s very easy to use. Enter a target computer or domain name, optionally choose a trace interval (15 options ranging from 1 second to 60 minutes), click Start and you’re off.
The application sends ICMP packets and displays a traceroute-like table of the results, including hop number, IP address, name, current and average ping time.
PingPlotter Free then repeats this process after whatever trace interval you’ve specified, displaying a graph of the average response time and range for each hop, along with a separate histogram which charts your round trip time for the last ten minutes.
The table and graph can be customized in various ways (figures displayed, graph color, more), and when you’re happy the image or figures may be copied to the clipboard for easy sharing.
None of this is going to transform your troubleshooting, as the developer has unsurprisingly reserved the best features for the Standard ($39.99) and Professional ($199.95) versions: 2 and 7 day histories, TCP/ UDP tracing as well as ICMP, customizable alerts, the ability to monitor multiple systems, and more.
PingPlotter Free is a likeable program, though, with more than enough visualization options to be useful, and if you’re not happy with your current Ping/ Traceroute tools then it’s worth the download.
