$200 million in U.S. broadband census data now free, open source

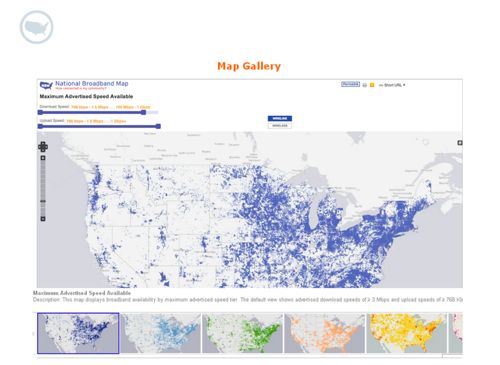
Thursday, the National Telecommunications and Information Administration (NTIA) released The National Broadband map, a staggeringly powerful free tool that gives anyone access to census-level data about broadband connectivity in the United States.
The map, which cost roughly $200 million to build, includes data from more than 25 million records, showing what types of broadband are available in all of the 50 U.S. states (FTTH, Docsis 3.0, Cable, DSL, Mobile, etc.), which companies provide service (and thusly where regional monopolies exist,) and the maximum advertised speeds. Users can then filter data by region, state, city, county, district, block, or even street address, or by regional and household demographic information. This data can then be plugged into the map's "analysis" feature, and compared with data from other areas.
Planning to move? You can input your address and compare it with other addresses to see how they stack up. With the open APIs, you can even build smartphone apps that do this for you.
Broadbandmap.gov hosts the map for standard consumer viewing, but it is also available as a downloadable package, and through open APIs for developers who want to build applications utilizing this precious data. All of the maps and site data were built by IT firm CompuTech with open source software like OpenGeo and WordPress, and map data is scheduled to be updated twice annually to keep figures current as the administration moves forward
with the National Broadband Plan.
"This cutting-edge tool will continue to evolve with the help of new data and user feedback," said FCC Chairman Julius Genachowski in a prepared statement on Thursday. "It will provide consumers, companies and policymakers with a wealth of information about broadband availability, speeds, competition and technology, and help Americans make better informed choices about their broadband services."
The map is expected to go live on Thursday afternoon.
