SysGauge is a comprehensive PC performance monitor

SysGauge (32-bit) is a highly configurable system and performance monitor for Windows.
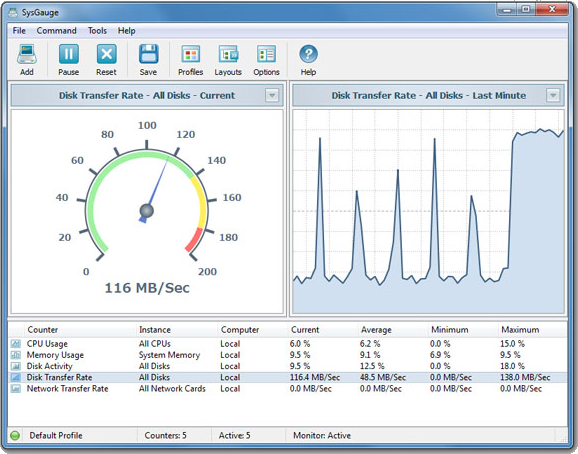
At first glance the program looks much like any other monitor gadget. Click the CPU, memory, disk or network counter, its current, average and minimum values are displayed, and a line graph shows how your counter is changing in real time. Yawn.
These are just the catch-all default counters, though, and the SysGauge "Add Counter" dialog has a lot more to offer.
For example, selecting "Disk I/O Activity" gives you counters for all I/O actions, reads only, writes only, read / write / overall transfer rates, read / write / transfer IOPs and more.
Choosing "Operating System" displayed counters for total processes, threads, server sessions, total user logons, logon errors, access denied errors, system errors, context switch rates, system call rates and more.
The "Process Status" section enables drilling down to an individual process, and monitoring its CPU or memory usage, handle count, thread count, read / write / data rates, and more.
There's even an option to connect to a network computer and monitor that, too.
Once you're up and running, reports may be saved on demand, or automatically at regular intervals. HTML, PDF, Excel, CSV, TXT and XML formats are supported.
SysGauge supports adding one or more conditions to any counter. You can have the program check the current, average, maximum or minimum values, and carry out some action if its outside a specified range: play a sound, send an email, shut down or restart your system.
SysGauge had one issue on our test system. The default "Network Transfer Rate" for "All network cards" was permanently set at zero, whatever we did. Changing the counter to use a specific network adapter fixed the problem, but that shouldn’t be necessary.
Aside from that, the program did everything we expected and a whole lot more. If you're tired of basic monitors, but not quite ready for Windows Performance Monitor, SysGauge could be a smart choice.
