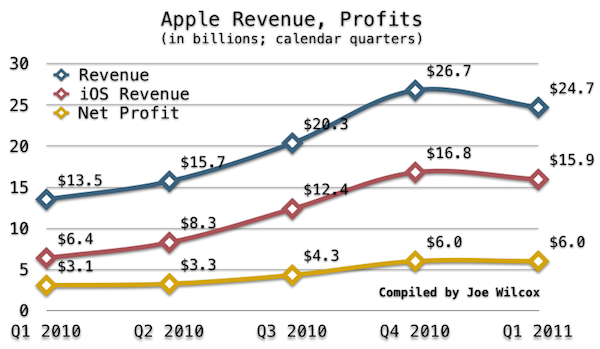
Chart: Apple's amazing year of iOS

Mobile devices running iOS generated $43.79 billion for Apple during calendar 2010, or about 57 percent of revenues. But it is the rise in overall revenue and net profit that is most significant, as seen from the chart above. Perhaps more surprising, Apple's calendar first quarter 2011 net profit was just slightly less than that of the holiday quarter, when iOS device sales were even stronger.
The revenue curve from Q1 to Q4 2010 is simply stunning. Apple revenue nearly doubled, as did its net profit -- from $13.5 billion to $26.7 billion and $3.1 billion to $6 billion, respectively. In April 2010, Apple launched iPad, which generated about $10 billion in revenue during 2010. Without iPad, Apple would have generated only $66.28 billion last year -- still impressive.
By my reckoning, Apple sold about 81 million iOS devices during 2010 -- or about half the number Apple says had shipped by the end of first calendar quarter 2011.
While the gains across the metrics are absolutely impressive for calendar 2010, first quarter 2011 stands out by a different measure. Not surprisingly, Apple revenue fell by about $2 billion going from the holiday quarter, which is to be expected. What's startling: Net profit dipped slightly, $5.99 billion from $6 billion, during sequential quarters.
The revenue surge is over, and the chart for 2011 will likely be different. Apple is forecasting $23 billion revenue for second calendar quarter. Throughout 2010, Apple exceeded forecasts by at least $1 billion a quarter -- $2.67 billion for calendar Q1 2011. So calendar Q2 could still grow sequentially. Wall Street analysts are projecting $24.45 billion for the quarter, but their estimates have been running low, too.
