Project GeoFlow gets public preview

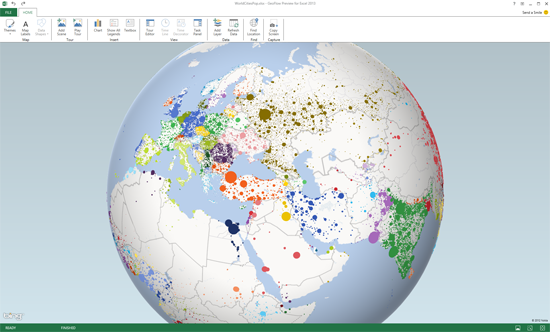
Microsoft announced GeoFlow at the SharePoint conference in November 2012 and today rolled out a public preview of the 3-D mashup that combines the Office spreadsheet app Excel with Bing maps to allow you to plot geographic and temporal data visually.
Microsoft Research claims that GeoFlow "enables information workers to discover and share new insights from data through rich, 3-D data on a globe and fluid, cinematic guided tours—virtual cinematography moving through data". The app evolved out of the WorldWide Telescope project. "We built a gigantic virtual telescope, but to do so, we had to build an engine that could visualize the universe. If we can visualize the universe, we can visualize almost anything else", Microsoft Research principal researcher Curtis Wong explains.
Wong says that with GeoFlow the goal was to bring dynamic and interactive data visualization to the business world. "We wanted to explore new tools that could help us understand the large-scale temporal and geospatial trends that affect businesses" Wong says.
The project was greenlighted way back in June 2011, but has taken some time in development. "Sometimes research requires a long-term view", Wong states.
Now every users can begin experimenting with GeoFlow, but you will need to be running either Microsoft Office Professional Plus 2013 or Office 365 ProPlus in order to give it a test run.
