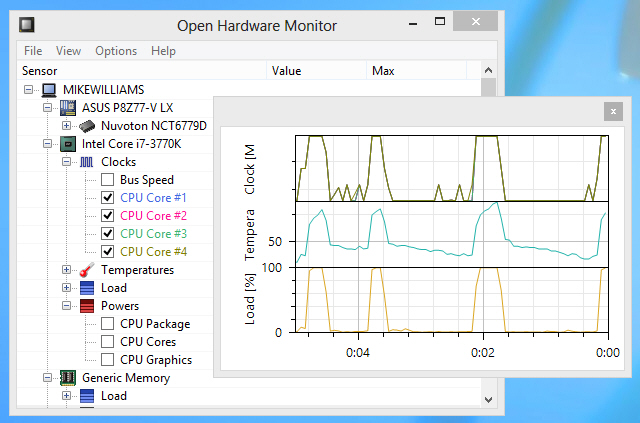
Open Hardware Monitor lets you track PC temperature, fan speeds, voltages and more
 Whether you’ve been overclocking your PC, are worried about a specific device, or just wondering why your system has been so unstable recently, getting a better understanding of your computer’s inner workings can be very useful. And grabbing a copy of the Open Hardware Monitor is a great place to start.
The program is free, open source, and surprisingly easy to use. Unzip and launch it, and a simple tree view immediately displays temperatures, fan speeds, voltages, CPU load and more.
Good hardware support means you should get details for most key devices. Our test PC displayed detailed sensors for its motherboard, CPU, graphics card and hard drives, for instance, as well as more general information like available RAM, free hard drive space and more.
At its simplest, you can just browse the tree, checking the values, or watching them as they update (running some heavy duty app to see how it affects your CPU temperature, say). Or maybe print your system status as a text report for easy reference later.
Open Hardware Monitor can also plot graphs of your chosen values over time, though. Click View > Show Plot, then check the "GPU Core" Temperature and "GPU Core" load boxes, for instance, and you’ll find out how your graphics processor load relates to its temperature.

Maybe you’re only interested in a single value? Right-click it for an option to display an indicator in your system tray, or on a desktop gadget.
If you really know what you’re doing, there are even options to make the reports available via a simple built-in web server, while publishing its data via WMI means it can be accessed and used by other software.
But perhaps best of all, there’s no installation here, no drivers, nothing intrusive at all: Open Hardware Monitor just consists of an executable and a few DLLs, 1.25MB of files in total, which you can use almost anywhere. Go check it out.
Photo Credit: Sergii Korolko/Shutterstock
