Capture and explore network traffic with Microsoft Message Analyzer
Microsoft Message Analyzer is an expert-oriented tool for capturing, displaying and analyzing network traffic, file activity, Windows Events and device activities on Windows 7 or later systems.
This data may be filtered and presented in grids, charts, graphs, timelines and more. While the program is aimed at developers and system admins, if you’re comfortable with tools like Sysinternals Process Monitor then you could also find it handy.
To get started, launch Microsoft Message Analyzer as an administrator. The "Favorite Scenarios" lists common capture types: click "Loopback…" if you’re using Windows 7 or 8, "Local Network Interfaces" if you have Windows 8.1 or later.
The program opens a Session tab, starts capturing the details defined by the scenario (network capture in our example), and displaying the results in the grid.
Media player-like toolbar buttons allow pausing, stopping or restarting captures with a click.
Open a browser, collect emails, run some other web-related software, scroll down the grid and you’ll see source and destination addresses, traffic types and more.
When you’re happy there’s enough information to explore, click Stop to stop the capture.
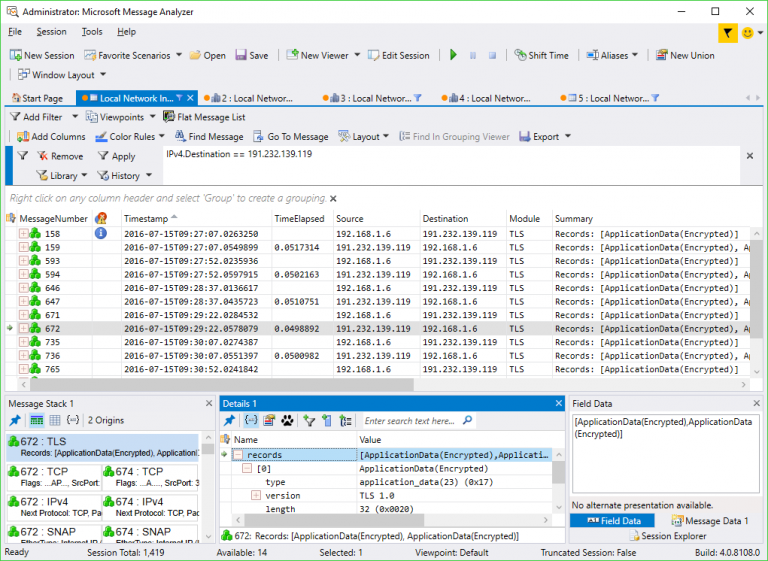
The grid is immediately useful as a report of network and internet activity during the capture time. There’s also a message stack which displays the sequence of events.
Clicking a particular HTTP (or whatever) message drills down to the raw details: URI, HTTP version, header, content-type, whatever.
The grid will have a lot of data, but filters help you zoom in on whatever you need. If you’ve found an interesting destination IP address, for instance, right-click it and select "Add Destination to filter". This updates the filter box above the grid, and if you click "Apply" then only traffic with that IP address will be displayed.
When you’ve had enough of scrolling through the grid, click Sessions > New Viewer > Chart for all kinds of traffic-related analyses and graphs. Click Default, for instance, and a bar chart appears showing protocol types.
The new view appears as a separate session tab, although actually it’s just another way of looking at the same data. If you restart capture, for example, you can watch the bars update in real time. You can drill down here, too, perhaps double-clicking "TCP" to view a grid of only TCP traffic.
If this isn’t enough, you’re also able to export the data for analysis elsewhere. Click Session > Analysis Grid > Export (or click Export on the toolbar above the filters) to save the traffic as CSV.
Microsoft Message Analyzer may look intimidating -- and even experts will struggle to understand everything the program can do -- but it’s also far easier to use than you’d expect. If you’ve occasionally used Sysinternals software, network capture tools or other system monitors, we’d recommend spending a couple of hours with the program to get a feel for what it can do.
Microsoft Message Analyzer is a free application for Windows 7 and later.