Microsoft releases Java debugging extension for Visual Studio Code
Visual Studio Code is an amazing cross-platform code editor which has managed to attract a significant following in recent years, not least because of its support for extensions. In just a couple of clicks, users can add various languages, like Python, Ruby and Java, and create new software.
For example, if you want to write Java code, there is a pretty nifty extension made by Red Hat, called Language Support for Java(TM) by Red Hat, that features things such as IntelliSense and basic Eclipse and Grade project support. And, now, Microsoft is building upon it by adding a debugger to the mix.
Aptly named Java Debugger for Visual Studio Code, Microsoft's new extension is designed as a complement for Language Support for Java(TM) by Red Hat, being offered standalone and as part of a Java Extension Pack, which lets you install both in a single go.
"This is just the start to creating a modern workflow for Java and we'll be adding more features and extensions to the Java Extension Pack in the future," says Microsoft's Xiaokai He on the Visual Studio Code blog.
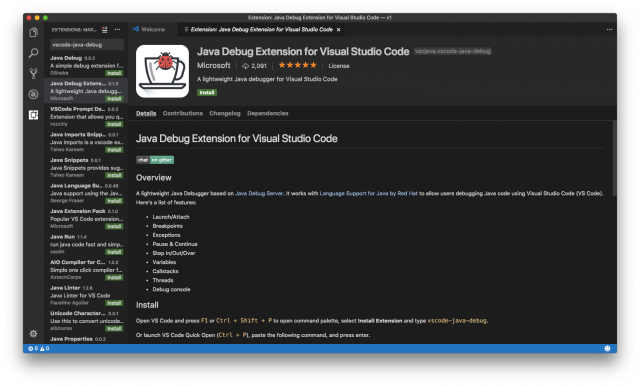
Java Debugger for Visual Studio Code, which is currently in preview, comes with features such as breakpoints, exceptions, variables, callstacks, threads, a debug console and more. It is easy to install, and, like you would expect, available for free too.
Considering that Microsoft wants to beef up Java support in Visual Studio Code, it is a good idea to install the Java Extension Pack to get the best user experience and receive the latest upgrades as they are made available.