NirSoft unveils SimpleProgramDebugger
 Nir Sofer has announced the release of SimpleProgramDebugger, a tiny portable debugger which runs on anything from Windows XP to 8.
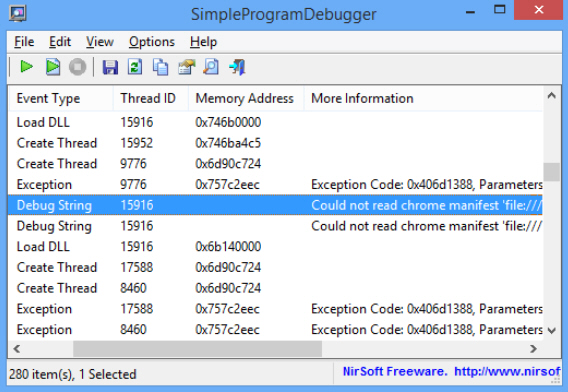
The program can attach to a running process, or start a new process in debugging mode. There are no options to control or interrogate that process, but SimpleProgramDebugger will display its main debugging events: Load DLL, Unload DLL, Create Thread, Create Process, Exit Thread, Exit Process, Exception and Debug String.
This kind of tool is typically aimed at developers who are analyzing their own code, and most of the details it provides will be meaningless to anyone else. Still, experienced PC users might also find a few valuable nuggets here, just occasionally.
We used SimpleProgramDebugger to launch Firefox, for example, and immediately saw the DLLs it loaded on startup, including those for our security package.
Better still, several interesting and previously unseen "debug string" messages appeared, including "Failed to load native module at path…", "Could not read chrome manifest ‘file@///" and "…could not create service for entry…". What did these mean? We’ve no idea, but if Firefox were misbehaving then this is just the type of information which might point us in the right direction.
SimpleProgramDebugger is short on functionality, then, too basic to be a good debugger or system monitoring tool. The program can occasionally provide helpful troubleshooting details, though, and it’s worth keeping a copy around, just in case.