Troubleshoot your PC’s memory problems with Sysinternals RAMMap

Understanding your PC’s RAM usage is a key part of troubleshooting many odd Windows problems, but unfortunately this isn’t always easy. The standard tools, like Task Manager, are fine for diagnosing simple issues, but just don’t provide the information you’ll need to cope with anything more complex.
As usual, though, Microsoft Sysinternals has a portable tool which can help. RAMMap provides a very in-depth look at your PC’s current RAM usage, and while it’s aimed mainly at Windows experts, the program also has some elements which will be useful to just about anyone.
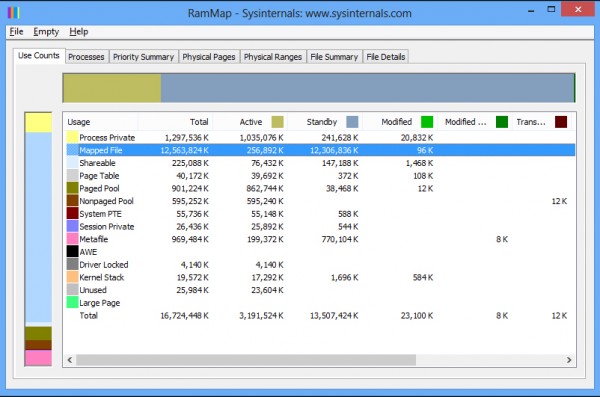
Launch RAMMap and it displays your RAM details in a tabbed interface. There’s a lot of jargon here, but a good place to start is by looking at the "Active" column, which details memory which is currently in use, then scanning down the list of categories to see which is consuming the most.
If the "Process Private" figure is top of the "Active" list, for instance, then this means most of your system’s RAM consumption is due to memory allocated by a single process. Click the Processes tab, then the Private column header to spot the most resource-hungry programs.
You can do something similar to that in Task Manager, of course, but RAMMap also shows you memory allocated to "mapped files". If this is the highest figure then perhaps a program is mapping some really large files into memory. Clicking the "File Summary" tab, then the "Active" column header will again reveal the RAM hogs.
Take a look at the "Drive Locked" category, too. Some drivers might naturally lock a large amount of RAM -- a RAM disk, say -- but if you otherwise spot a large increase here, with no obvious explanation, then that could indicate some kind of driver problem.
While you’re at the Use Counts tab, take a look at the Bad column, at the far right. If Windows detects a physical RAM page which seems bad then it’ll be listed here. You should never see anything in this column, but if you do, this may mean your RAM is failing. Run the Windows Memory Diagnostic tool (or any other RAM checker) to look for problems.
RAMMap has plenty of other details, too. They’re usually not quite some important, but if you’d like to read more, then Microsoft’s "Ask the Performance Team Blog" has a general rundown (although beware, it assumes a fair amount of low-level knowledge about Windows memory use).
Sometimes all the figures may just look normal, of course, but if nothing else you could just try comparing the current "Use Counts" report with one you’ve taken earlier. If your system slows down and RAM appears to run out over time, say, then run RAMMap once when your system boots, saving the report (File > Save), then run it again later. Compare the two reports and this might give you a clue as to what, if anything, has changed.