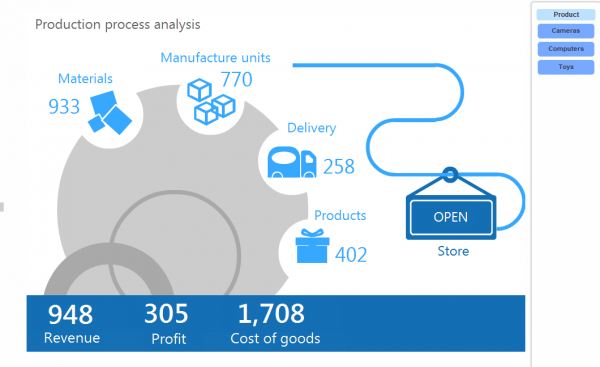
New business intelligence tool uses infographics to open up data

Business intelligence is all about making dry figures accessible and useful to managers and others within an enterprise.
Canadian company Panorama Software is aiming to create a better data discovery solution with the launch of its new Necto 14 product. It allows users to explore, measure, track, and share critical data visually to gain knowledge, boost collaboration, and make smarter business decisions.
"The vast majority of business users consider current BI tools too complex and difficult to use. All types of people are demanding easy self-service access to more types of data, and a more intuitive way to represent and communicate their critical business metrics," says Eynav Azarya, CEO at Panorama Software. "Panorama Necto 14 offers a fresh new way for both business users and power users to review, present, and track data using context-specific visual images rather than confusing, complex graphs and reports".
Necto 14 produces infographics to present complex data in a clear and straightforward way. These are directly linked to the data and so can reflect changes in real time, making them ideal for applications like call center dashboards. They can also be used in self-service applications allowing staff to extract the data they need to do their jobs.
It offers what the company calls a 'single vision of truth' that lets users mash up data from various sources and collaborate throughout the decision making process. Other key features include a drag and drop user interface to simplify queries, a notification system to send alerts via email or dashboards and open database connectivity.
Necto 14 is available from today, for more information visit the Panorama website.
