Overcoming observability challenges in the CI/CD Pipeline
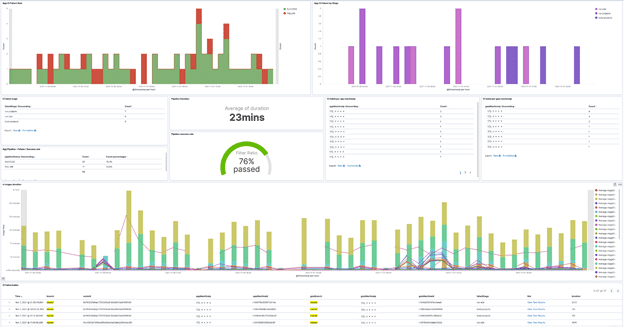
When most companies monitor and analyze their software systems, they focus on the most obvious ones. But one essential service often slips through the cracks: the continuous integration/continuous delivery (CI/CD) pipeline. This poses three main observability challenges: pipeline investigation efficiency, pipeline performance, and the ability to access historical data.
Every time developers push out a new version, their pipeline run is triggered. A set of commands checks to make sure everything is valid, that the build process is all right, and that all tests have been passed. If everything checks out, the new service version is deployed to production.
But something could still go wrong in the CI/CD pipeline, and even the best tools may not catch it. For example, with Jenkins, users can't easily access aggregated and filtered information from several pipelines' runs that belong to different branches. They can't fetch historical data.
However, it is possible to overcome observability challenges in the CI/CD pipeline and avoid application failure. The key is to understand the data, identify where the pipeline investigation is inefficient, review pipeline performance, and keep historical data. Here's how we did it in our own organization.
Collecting and Indexing CI/CD Data
To understand what kind of data was necessary for observability, we need to understand: How does the Jenkins server know what to do in order to help us package, build, and run tests, etc. in an automatic way? Once we did that, we could run a script that tells Jenkins what to do to automate our integration process. Our script consists of several steps we considered necessary for our CI activity. In addition, we added another step at the bottom of our script, and we called it the "Summary" step:

The "Summary" step ran a command that collects all the relevant information from our pipeline's environment variables, such as branch, commit SHA, machine IP, and failed step. We even measured each step's duration and stored it under ${stepName}-duration env for reasons we will explain later.
After collecting all the relevant information to properly track and analyze our pipeline, we sent it as a JSON object to our managed Elasticsearch service. This means the data is now available anytime for querying, visualization, and alerting. Then we created Kibana visualizations required to meet the observability needs and composed them into a dashboard.
Improve pipeline investigation efficiency
Before using our "CI failure summary dashboard," we needed to undergo a thorough investigation of our pipeline, which was time-consuming.
First, we entered into our Jenkins UI manually. Next, we searched for our specific pipeline from the list of pipelines used for all projects we manage. After finding our pipeline, we filtered the desired branch from all pipeline runs. This left a list of all runs belonging to a specific pipeline with a specific branch (e.g., all app-pipeline's runs are triggered from pushing to the master branch).
Suppose that all the latest runs displayed as failed:


Without the option of monitoring our pipeline's activity properly or automating it, we needed to manually view the runs.
We entered the first run that failed to see which step caused the failure (checkout, build, run, tests, etc.). After identifying the failed step, we needed to understand if all pipeline runs failed on the same step, and if so, did they fail for the same reason?
We needed to answer several questions to properly monitor our pipeline's activity:
- Did all runs fail on the same step?
- Did all runs fail for the same reason?
- How many runs failed for the same reason?
- Did our failure occur only under specific branch runs? Or maybe it happened in other branches as well?
- Did our failure occur only when the pipeline ran on a particular machine? Or did it happen on all devices?
It became too difficult to track and too time-consuming to monitor.
Adding scheduled notifications improved this experience significantly. These notifications are delivered every morning in Slack, linked to the dashboard that shows what has happened in the pipeline for the past two days.
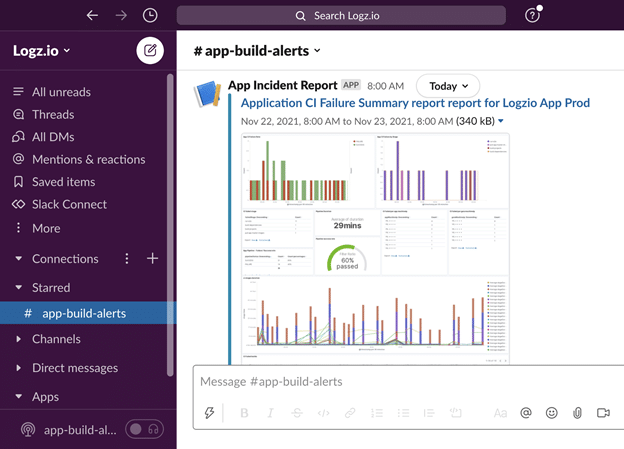
Just from the Slack alert, before opening the dashboard itself, we can tell if everything is sustainable or not.
Now diving deeper into the summary report, the below figure differentiates successes and failures. For three hours, the pipeline was green, indicating that everything was fine. We did not need to access the Jenkins UI to investigate.

Suppose this level of insight is not enough. In that case, we can dive even deeper by entering the dashboard's link directly into the platform. Furthermore, these insights can show essential data points like:
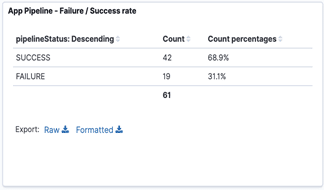
- Differentiated success from failure rates using percentages aggregated as average amid our time range. This helps us understand how stable our pipeline is.
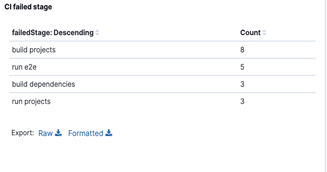
- Identify problematic pipeline steps by seeing how many failures we had originated from ${stepName} (e.g., "build projects") amid our time range.
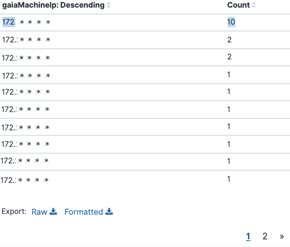
- Identify problematic pipeline machines. The machines had only one or two failures while running our pipeline's flow on the following visualizations. Still, one device showed a significantly higher number of failures amid our time range.
This indicates that our pipeline is not the problem. Likely, a memory leak or high CPU usage inside the machine was the issue.
The visualizations help us track the machines on time, remove the problematic ones, and auto-scale new devices to come online before they derail our developers' deployment process.
Improve pipeline performance
Before collecting our CI/CD pipeline's data, we could monitor performance by step for specific pipeline runs. More specifically, we could enter into a particular pipeline's run and understand how long it took to execute each step.
But we wanted to find a way to monitor aggregated and filtered information from all pipeline runs, branches, and machines to see the complete picture on a scaled time range with our own filtering demands. Once we started tracking and analyzing information from our pipeline, we could utilize it to achieve this monitoring goal. As mentioned above, we added additional environment variables named ${stepName}-duration to help provide more precise data.
Each pipeline's run shipped how long it took to execute each step. We could access this information and present it inside our dashboard.
In this example, we can see the shipped ${stepName}-duration data:

After aggregating all pipeline runs and filtering them with our Kibana dashboard, the visual shows duration.
In the above example, we see a peak for aggregated results under a step called e2e_v2. More specifically, on November 6, 2021, at 8:00am, the average of our aggregated results took 32 minutes, unlike all the other steps that ended much faster. This peak returned a lot amid other dates we tested. It indicated that our e2e_v2 step increased our pipeline's execution time significantly for a long time. After finding the problematic step, we investigated the root cause. We developed a solution to reduce our e2e_v2's execution time and, therefore, our pipeline's execution time because we had observability in our pipeline.
Access historical data
By default, Jenkins keeps all builds. Deleting old builds is recommended to save disk space on the Jenkins machine. However, we can adjust the "Days to keep builds" and "Max # of builds to keep" options.
We are limited to Jenkins persistence capabilities, and we could go back to investigate historical runs of our pipeline only as far back as Jenkins allows. If we want to access information from a year ago, we’ll need to make some adjustments. This can help us understand if we have a recurring problem, allowing our team to quickly identify both the problem and solution by dates and failure reasons.
Now we can access our logged historical information that we persisted in our Elasticsearch and query it using Lucene in Kibana Discover:

Summary
Now that you're equipped with the knowledge and background on how we gained observability for our own pipeline, let's review the basics:
- Store all pipeline's relevant information inside env variables or alternative approaches your team prefers.
- Create pipeline's step (summary) and run a command that knows how to access all the relevant information collected, such as branch, commit SHA, etc.
- Send the relevant information using a custom library, similar to log using logger-service, and store it for future usage.
Now that your pipeline's data is stored, you can easily access, analyze, and monitor it.

Royi Sitbon is App Core Team Lead at Logz.io. Thanks also goes to Alon Mizrahi for being a partner to the implementation process and Dotan Horovits for his contribution to the article.
