Identify, monitor and overclock your GPU with NVIDIA Inspector

NVIDIA Inspector is a versatile tool for checking, monitoring and overclocking NVIDIA graphics cards.
This can be a complex area, but smart design ensures the program has something to offer every level of user.
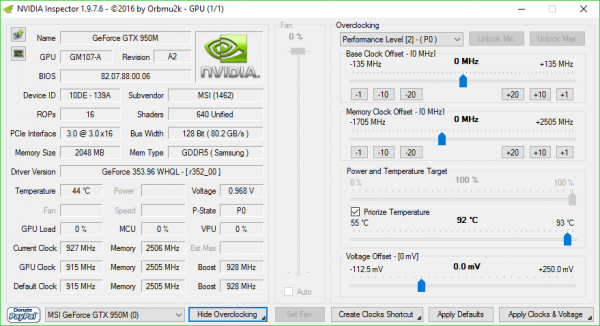
If you need to identify your hardware, just running the program will display plenty of useful information: name, GPU, BIOS, vendor, memory size, driver version, temperature, voltage, GPU load, and various clock speeds.
Maybe you're looking for a hardware monitor? Clicking the tiny graph icon displays real-time graphs for GPU usage, clock, temperature and voltage.
A right-click menu enables adding further monitors for VPU and MCU usage, memory and shader clocks, power, fan levels, PCB temperature and more.
The graphs look good, but aren't much use if you’d like to monitor your system over time, perhaps while playing some graphics-intensive game. Fortunately there's optional logging to CSV, making it easy to properly analyse this information later.
There's even an overclocking section, with sliders to set base and memory clocks, power and temperature targets.
Overclocking is potentially dangerous -- which is why the developer hides it by default -- but if you know what you're doing, and use the monitors to watch what's happening, it may deliver a useful speed boost.
You even get a separate NVIDIA Profile Inspector, which displays and gives access to all your driver settings. Even the low-level ones, which hardly anyone understands.
It’s an impressive package, packed with features and functionality, and still being actively developed. Take a look.
NVIDIA Inspector is a free tool for Windows XP and late.