Process Explorer 15 adds GPU monitoring

Process Explorer has always been one of the best PC monitoring and troubleshooting tools around. There's always room for improvement, though, and the latest version sees a very useful addition in the ability to track graphics processor (GPU) usage on Windows Vista or later.
You won't see this by default when the program first launches, but that's easy to fix. Click View > Select Columns > GPU and check the boxes next to whatever you'd like to watch: GPU Usage, GPU Private Data, GPU Committed Bytes, or GPU Shared Bytes.
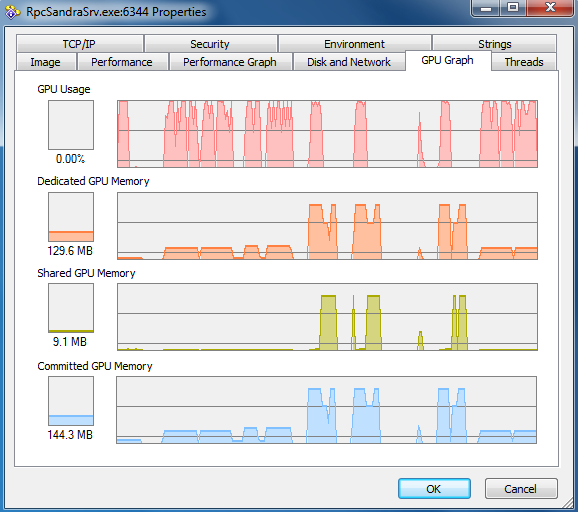
A click or two later and you'll be better able to spot any resource hogs that might be slowing your system down. This seems to work very well: we ran a few graphics benchmarks, and Process Explorer gave us a detailed view of what they were doing. But if you prefer a graph, rather than the raw data, just double-click a process, click the new GPU Graph tab, then watch to see how your app's GPU usage varies over time.
Other improvements in this build include the ability to restart a service. Double-click a svchost.exe instance, click the Service tab, choose a misbehaving service and click Restart, and Process Explorer will stop and start it for you. (Be careful, of course. Restarting the Spooler service, for instance, may fix some printing problems, but choosing something more critical may lock or crash your PC.)
And elsewhere, the performance graphs have been revamped to have a cleaner look, while a range of optimisations mean the program now has a smaller memory footprint. Not that Process Explorer was ever exactly a resource hog, but this version is now more efficient than ever, requiring little more than 14MB (private working set) to monitor all the usual process properties on our test PC, and the new GPU details as well.