Troubleshoot tricky PC problems with SpyStudio
 In an ideal world, diagnosing software problems would be easy. If a program couldn’t find a vital DLL or Registry key then it would display a detailed error message, describing both the problem and solution, so you could get everything working again with the minimum of hassle.
The real world, of course, is very different: failing programs will generally crash, lock up, or display an error message which means almost nothing at all. Checking with the developer, or searching for your symptoms online may offer some clues. But if you’re getting nowhere, then SpyStudio 32-bit and 64-bit might be able to help you understand what’s going on.
The free-for-personal-use program is a user-mode API monitor, a powerful troubleshooting tool which can track what an application is doing -- the Registry keys it’s accessing, the files it’s reading and writing, any windows it’s created, the COM objects it’s using, and more. It’s aimed at developers and other Windows experts, but don’t let that put you off. Spy Studio works in a similar way to Sysinternals Process Monitor, and if you’re happy using that, or similar Sysinternals tools, then you’ll be able to use and get at least some benefit from the program.
To get started, you must first "hook" the application or process you’d like to monitor. If the program is running already, right-click it in the Process list and choose "Hook" (if the process is grayed out, that means you’re using 32-bit Spy Studio; download the 64-bit edition instead). Otherwise click the browse button next to "Execute and Hook", choose your target executable and click "Play" to launch it.
Having SpyStudio monitor an application means it’ll run much, much, much slower than usual, so you’ll need to be patient. But otherwise wait for the program to launch, run whatever other tests you want to do with it, and when you’ve finished, click Analysis > Stop All to end monitoring.
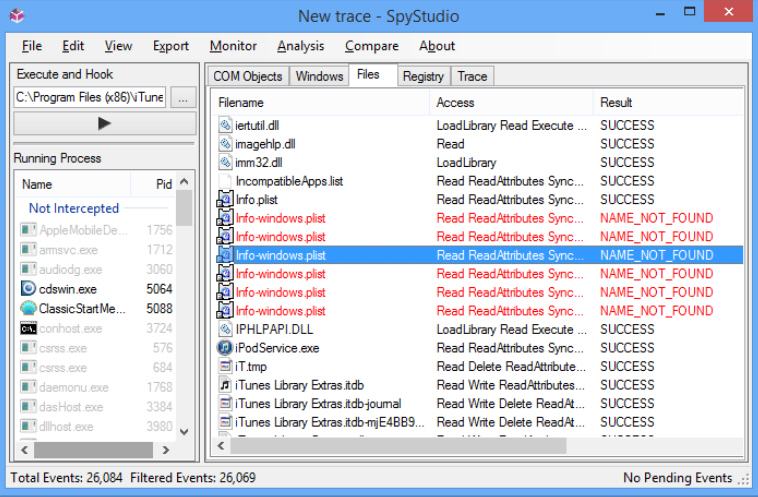
The results of SpyStudio’s monitoring are displayed across five tabs. The most straightforward is probably "Files", which lists every file the process has tried to access while it was monitored. You’ll see the file name, how it was accessed (just to read, to read and write, to execute and more), the number of times it was accessed, and more. Any calls which result in an error -- the file doesn’t exist, say -- are displayed in red. This may not mean anything, but if the file is critical then it could be the reason your program is failing, so you might want to investigate those first.
The Registry tab provides similar information on Registry keys your program has tried to access. These are presented in a Registry tree, you can browse it to any key or value of particular interest, and again anything that’s resulted in an error is displayed in red.
The "Trace" tab provides a full list of all the monitored calls, allowing you to see every Registry access, file read and write in sequence. There will probably be thousands of calls here, so don’t expect too much, but it can occasionally be useful.
Elsewhere, the "COM Objects" tab details the various system components your program has tried to use, while "Windows" shows any windows it’s created. Any clues might help, so take a look, but these probably won’t mean much unless you’re a Windows expert.

This kind of API reporting can’t solve every problem. If a program is failing because of some logic or math issue, say, then you’ll be out of luck. But Registry and file-related issues are common enough to justify checking, and SpyStudio 32-bit and 64-bit can track even more calls, if necessary (click Monitor and choose Drivers, Internet, Shell and so on). Overall it’s an excellent system monitor, technical yet easy to use, and a must-have for every geek’s troubleshooting toolkit.
Image Credit: Jamesbin/Shutterstock
